Introduction
Earlier articles on this blog about the Game Boy Advance and the Nintendo
DS, among them the cycle-level optimization one
and the one on faking point lights on the DS GPU,
shared a premise: these machines have a CPU with no floating-point unit,
and a graphics pipeline that makes you pay for every vertex somewhere. The
GBA pays in rasterizer cycles. The DS has a real hardware 3D engine, so it
pays somewhere else, and that somewhere turned out to be the part of the
frame nobody was looking at.
Note
framer-engine is a personal side project. The source code will be
made publicly available once the engine reaches a sufficient level of
maturity.
The framer-engine spinning_shapes example puts a cube, a sphere and
a cone on screen, each rotating, and a button toggles between drawing them
solid and drawing them as wireframes. On the DS it ran at 60 FPS in solid
and about 20 in wireframe. Wireframe should be the cheaper of the two:
fewer pixels filled, no lighting. That a debug visualization would be three
times slower than the real thing was the bug report, and there was a
second, less obvious question behind it: how do you even measure a frame on
a platform you can only run in an emulator?
How wireframe gets drawn on a GPU that has no lines
The DS 3D engine draws triangles and quads, and nothing else:
framer-engine's source notes that libnds' glBegin() takes only
triangles and quads (and their strips), with no line primitive. The hardware does
have a wireframe polygon mode, selected by a polygon alpha of zero, but it
outlines a polygon's own edges. The engine's meshes keep a separate list of
the edges they actually want drawn, and for a sphere that list leaves out
the diagonals that split each patch into two triangles; asking the
hardware for wireframe would draw them. (That is the reasoning, not an
experiment: the mode was never tried.) So wireframe here means what it does
on most hardware without lines: a thin quad along every edge, drawn flat and
unlit.
Building that quad takes some care. It has to be widened perpendicular to
the edge, in a direction that makes sense for a convex mesh centered on its
own origin, so the code takes the direction from the mesh's origin to the
middle of the edge and removes the part of it along the edge:
/* per edge, every frame */
float edge_len = sqrtf(edge[0]*edge[0] + edge[1]*edge[1] + edge[2]*edge[2]);
float mid_len  = sqrtf(mid[0]*mid[0] + mid[1]*mid[1] + mid[2]*mid[2]);
dir[k]    = edge[k] / edge_len;          /* k = 0..2 */
radial[k] = mid[k]  / mid_len;
dot       = radial[0]*dir[0] + radial[1]*dir[1] + radial[2]*dir[2];
width[k]  = radial[k] - dot * dir[k];    /* perpendicular to the edge */
width_len = sqrtf(width[0]*width[0] + width[1]*width[1] + width[2]*width[2]);
width[k]  = width[k] / width_len * half_width;
/* then four vertices: a -/+ width, b +/- width, as 4.12 fixed point */
Correct, and unremarkable on a PC. On the DS's ARM9 it is three square
roots, nine divides, roughly fifty multiplies and adds and twelve
float-to-fixed conversions, per edge, every frame, and every one of those
is a call into a software floating-point routine.
Why not just look at the frame rate
The obvious next step, running the ROM in an emulator and reading the
frame counter, is the one that tells you least. melonDS' own speed varied a
lot from run to run in earlier debugging sessions on this project, so
anything derived from wall-clock time or its frame counter says more about
the host machine than about the console. What does hold still is the
emulated hardware's timers: the same ROM executes the same instructions
and the DS timers count them the same way every run.
libnds exposes two of them chained into a 32-bit counter through
cpuStartTiming() and cpuEndTiming(), which return ticks of the
hardware timer clock (about 33.5 MHz, the bus clock; the ARM9 itself runs
at twice that). A throwaway build wraps the 3D render system and stores the
result in a global per render mode:
volatile uint32_t g_diag_ticks[2];   /* [0] solid, [1] wireframe */
volatile uint32_t g_diag_count[2];

static void nds_hw3d_render_system(framer_iter_t *it)
{
    int w = framer_render_mode_get_override() ==
            FRAMER_RENDER_MODE_FORCE_WIREFRAME;

    cpuStartTiming(0);
    nds_hw3d_render_system_impl(it);   /* the real system, unchanged */
    g_diag_ticks[w] = cpuEndTiming();
    g_diag_count[w]++;
}
A copy of the example toggles the render mode itself every 120 frames, so
one emulator launch produces both numbers, and the globals are read over
melonDS' GDB stub, with their addresses taken from nm on the ARM9 ELF:
ticks = struct.unpack('<2I', bytes(rsp.read_mem(sock, tick_addr, 8)))
count = struct.unpack('<2I', bytes(rsp.read_mem(sock, count_addr, 8)))
The first run settled the question. Run twice, the figures agreed to within
a few ticks, which is the property that makes them usable:
| Mode |
Ticks per frame |
Time |
|---|
| Solid |
317,950 |
9.5 ms |
| Wireframe |
1,414,850 |
42 ms |
A 60 FPS frame is 16.7 ms. Solid fits with room to spare. Wireframe takes
42 ms in the 3D pass alone, which is more than two vertical blanks, so the
frame lands on the third and the screen updates every 50 ms: 20 FPS, to the
number. The frame rate wasn't a mystery, it was a quantization of a cost.
Where 1.4 million ticks go
The meshes are not small. The sphere has 20 sectors and 10 stacks, which is
430 edges and 360 triangles; the cone adds 40 edges and 40 triangles and
the cube 12 and 12. A wireframe frame therefore builds 482 quads, and a
solid frame submits 412 triangles. Dividing:
- wireframe: 1,414,850 / 482, about 2,900 ticks per edge, roughly 5,900
ARM9 cycles for the arithmetic above;
- solid: 317,950 / 412, about 770 ticks per triangle, which is a normal and
three vertices converted to fixed point and handed to the GPU, with no
square root and no divide anywhere in it.
So the GPU was not what set the cost in either mode. The CPU was, and in
wireframe it spent 42 ms of every frame, two and a half frame budgets, on
arithmetic whose answer is the same on every frame.
The data never changes
That last sentence is the whole fix. The cube is the same cube every
frame: only the model matrix it is drawn under changes, and the hardware
applies that matrix itself, on the GPU, from a matrix stack. Every
square root and every divide in that loop is computing the same four
vertices it computed 1/60th of a second earlier.
The DS has a mechanism for exactly this: a display list, a block of
pre-packed geometry-engine commands that glCallList() sends to the GPU
FIFO by DMA. Its layout is the hardware's own FIFO layout, documented in
GBATEK: a first word with the number of words that follow,
then groups made of one word holding up to four command ids, one per byte,
followed by the parameter words of those commands in order. A quad with
four vertices comes out as:
word 0   count
word 1   BEGIN_VTXS | VTX_16 | VTX_16 | VTX_16     (0x23232340)
word 2   1                                          (GL_QUADS)
word 3   x0 | y0 << 16                              vertex 0
word 4   z0
word 5   x1 | y1 << 16                              vertex 1
word 6   z1
word 7   x2 | y2 << 16                              vertex 2
word 8   z2
word 9   VTX_16 | NOP | NOP | NOP                   (0x00000023)
word 10  x3 | y3 << 16                              vertex 3
word 11  z3
Writing the packer is the small part: about eighty lines of plain C with
the command ids defined next to it (BEGIN_VTXS is 0x40, NORMAL 0x21
and VTX_16 0x23), no libnds dependency, and so unit-tested on the
desktop like any other pure logic in the engine, with the layout above as
one of the tests. libnds documents one trap that the packer simply avoids:
the END_VTXS command does nothing and is reported to cause trouble in a
DMA'd list, so lists never contain it.
void gx_dl_cmd(struct gx_dl *dl, uint8_t id, const uint32_t *params, int n)
{
    if (dl->slot == 4) {                 /* open a new command word */
        dl->cmd_at = dl->len++;
        dl->words[dl->cmd_at] = 0;
        dl->slot = 0;
    }
    dl->words[dl->cmd_at] |= (uint32_t)id << (8 * dl->slot);
    dl->slot++;
    for (int i = 0; i < n; i++)
        dl->words[dl->len++] = params[i];
}
The renderer bakes a mesh the first time it is drawn in a given mode: the
edge quads for wireframe, the triangles with their flat normals for solid.
After that a draw is a colour, a glCallList() and nothing else. Only
what is identical on every draw goes into a list; the colour, the
material, the polygon format and the model matrix stay with the caller, so
the same list serves every object that shares a mesh. Two kinds of object
keep the old triangle-by-triangle path because they vary something a list
would have to hold: objects with a colour per face, since the material
changes between faces, and textured ones, since their texture coordinates
are scaled by the texture's size. The old immediate wireframe code also
stays, as the fallback for a mesh that cannot be baked: more than eight
different meshes in a program, or no memory left for the list.
Results
Same scene, same instrumented build, measured the same way:
| Mode |
Before |
After |
Change |
|---|
| Solid |
317,950 |
18,500 |
17 times cheaper |
| Wireframe |
1,414,850 |
24,450 |
58 times cheaper |
The wireframe pass goes from 42 ms to 0.73 ms and solid from 9.5 ms to
0.55 ms. The two modes now cost about the same, which is what the original
bug report had assumed all along.
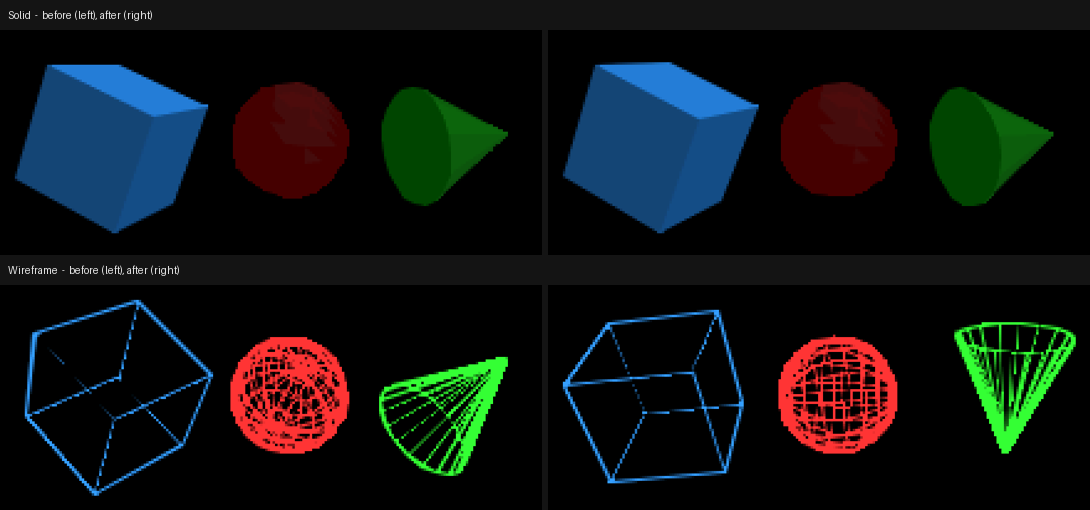
Faster is only worth anything if it is the same picture. The figure below
is the top screen before and after, captured from the emulator window in
the same runs as the numbers; the shapes are at different points of their
rotation because the demo keeps spinning, but the shading and the lines
are the same.
Three caveats belong next to those numbers:
- The GPU still has to consume the list. glCallList() flushes the
list from the data cache, starts the DMA and waits for it to finish, and
the DMA only completes once the geometry FIFO has accepted the data. melonDS
models the geometry engine's timing only roughly, so on a real console
that wait will be longer than 0.7 ms. It is waiting on the GPU, not
computing, and nothing was measured on real hardware.
- The first draw pays the old price once. Baking runs the original math
one time per mesh and mode, so the first frame in wireframe still does
what every frame used to. It is a one-off hitch rather than a rate, and
an unmeasured one.
- Lists cost memory. About 15 KB for the sphere's wireframe and 12 KB
for its solid list, allocated from the heap and held for the life of the
program.
What is still on the slow path
Objects with per-face colours and textured objects still submit triangle
by triangle, so a scene dominated by them gets none of this. Both can be
baked too: a per-texture-size list for the textured case, and one list per
colour run for the face-coloured one. They are the next candidates, and
the same method applies: measure the render system's ticks first, in the
mode that looks slowest, and let the number say where the frame went.
Introduction
The previous article on this blog was about the
static, no-heap Entity Component System framer-engine runs on GBA and
NDS: a fixed table of component slots and a fixed table of entities,
sized to fit in a machine with no malloc(). That fixed sizing has a
consequence the article didn't need to dwell on at the time: with today's
component set, the table has room for 64 real entities. A caravan-style
vertical shoot-'em-up, the first playable milestone this engine is
building toward, wants several hundred bullets on screen during a dense
pattern. Neither number moves to meet the other — the entity table isn't
growing to fit a bullet count, and a bullet pattern isn't capping itself
at 64 shots to fit the table.
Note
framer-engine is a personal side project. The source code will be
made publicly available once the engine reaches a sufficient level of
maturity.
The tension is old and the usual answer is old too: don't make every
bullet an entity. What took two attempts wasn't the bullet simulation
itself — a flat array of structs, advanced by one system, is not a hard
problem — it was deciding how that array gets drawn without quietly
opening a second, ECS-shaped hole in the renderer. The first answer
shipped, worked, and was wrong in a way no test had a reason to catch.
The second answer was smaller, matched a pattern the engine already had,
and went on to surface three real bugs across three different rendering
backends, none of which were about bullets at all.
The first answer: a queue that isn't an entity
The obvious shape for "hundreds of short-lived things, updated every
frame, drawn every frame, never touched individually by name" is a
per-frame queue: a flat array of draw commands (position, sprite, frame),
reset at the start of each frame, appended to by whatever wants something
drawn, and consumed once by the renderer at the end of it. A bullet pool
fits that shape exactly — push one entry per live bullet, once, after the
physics step — and it required nothing new from the ECS at all, since
nothing about it touched an entity, a component, or a query.
That was also exactly the problem. Every other thing this engine draws —
a sprite, a tilemap, a HUD label — is an entity carrying a component, and
every renderer's draw phase is systems iterating queries. A queue fed
directly by application code and drained directly by the renderer is a
second path with none of that: it isn't visible to the entity-inspection
API a previous milestone added, it isn't something a capability query
knows exists, and it isn't something any of the debugging tooling built
around "the ECS is the whole scene" has any way to see. It worked, in the
narrow sense that bullets appeared on screen in the right place moving
at the right speed. It didn't survive being looked at as architecture:
elements without an entity, bypassing the engine's own core model,
aren't a smaller version of the real design — they're a different
design that happens to render the same pixels.
The second answer: an entity that stands for many
framer-engine already had a component that solves this exact
class of problem, for a different feature: a Tilemap is one entity
whose component points at a grid the owner keeps, and the renderer draws
the whole grid from that one entity every frame. Nothing about "many
drawn things, one piece of external memory, one component pointing at
it" is specific to tiles. The rewrite generalizes that shape and gives it
a name — SpriteBatch — and the bullet pool becomes one more caller
of it instead of a bespoke path of its own:
struct framer_batch_sprite {
    int32_t x, y;       /* center, world units, fixed point */
    uint32_t texture;
    uint8_t frame;
    uint16_t size;       /* drawn size, world units, fixed point */
};

struct sprite_batch {
    const void *first;   /* owner's element array */
    const uint16_t *count; /* owner's live-element count */
    uint16_t stride;      /* bytes between elements */
};
A framer_bullet places its own struct framer_batch_sprite as its
first field, so the bullet pool's own storage array is the
SpriteBatch's element array — no copy, no second buffer kept in sync.
framer_bullet_pool_entity_create() gives the pool's one entity both a
BulletPool component, stepped every frame by a physics system, and a
SpriteBatch component built from the same array, drawn every frame by
the renderer. Every renderer's draw phase still only ever does one thing:
iterate a query and draw what it finds. Hundreds of bullets stay out of
the 64-slot entity table; nothing draws that isn't reachable from an
entity.
That much is a straightforward generalization of an existing pattern, and
it's also where the interesting bugs started, because a component that
every renderer backend has to independently learn to draw is a component
that gives every renderer backend its own chance to get it wrong.
Bug 1 (Vulkan): a guard that was checking the wrong component
Every renderer backend's sprite system is imported once per world, and
every one of them has to answer the same small design question: how do
you know "once" has already happened? The naive answer, comparing the
stored world pointer against the one you were just called with, breaks
the moment a different world gets allocated at the same address —
which is exactly what every test in this codebase does, tearing a world
down and creating a fresh one for the next case. The existing convention
across this codebase's renderer imports is therefore to also check that
some component the import function itself registers is actually present
on the world in front of you, not just that the pointer matches.
The version of this check written for SpriteBatch picked the wrong
component to check:
/* Wrong: Sprite is registered by the renderer's own import, before
 * this function ever runs -- it says nothing about whether THIS
 * function has run on this particular world. */
if (s_world == world && FRAMER_COMPONENT_IS_REGISTERED(world, Sprite))
    return;
On a fresh world reusing a previous world's address, Sprite is
already registered — by the caller, earlier in the same
framer_sprite_system_import() — before this guard is ever reached.
The check reports "already set up" on the very first call, every time,
and the function returns without ever registering SpriteBatch or its
draw system. Sprites drew fine; batches never did.
This one didn't need staring at code to find — it failed exactly where a
test already existed to catch it. The new pixel-readback test for
SpriteBatch (draw an element, read the pixel back, expect it filled)
passed against the software and OpenGL backends and failed against
Vulkan specifically, because Vulkan's test suite happened to run a batch
test on a world whose address a prior test had already used. Fixing the
guard to check the component this function actually registers —
if (s_world == world && FRAMER_COMPONENT_IS_REGISTERED(world, SpriteBatch))
    return;
— was a one-line change once the failing test pointed at exactly which
world-reuse case was wrong. The same wrong-component shape was checked
for, by inspection, in the OpenGL and software backends before either
one had actually failed a test; both had the identical guard, both got
the identical fix, and both were then verified rather than assumed
fixed.
Bug 2 (OpenGL): reading back a write that hasn't happened yet
The OpenGL backend's default shaders are compiled lazily, the first time
anything asks for one, and cached in the world's own Shader
singleton component so the next thousand callers don't recompile
anything:
const struct shader *shaders = FRAMER_GET(world, FRAMER_ID(Shader), Shader);
if (!shaders) {
    unsigned int sprite = framer_shader_create(...);
    /* ... compile the other three default shaders ... */

    FRAMER_SET(world, FRAMER_ID(Shader), Shader, .sprite_shader = sprite, /* ... */);
    shaders = FRAMER_GET(world, FRAMER_ID(Shader), Shader);
    if (!shaders)
        return 0;
}

switch (type) {
case SHADER_TYPE_SPRITE: return shaders->sprite_shader;
/* ... */
}
This is correct exactly as long as a component write, from the caller's
point of view, takes effect immediately. It doesn't, unconditionally: a
write issued from inside a running system is staged and only merged once
every system scheduled for that step has finished, so a second system
in the same step can already see it, but the same call that just made
the write cannot read it back synchronously. That's an ordinary property
of this ECS, not a bug in it — every other caller of
framer_shader_get_default() had always been either the very first
mesh or sprite draw of an existing scene, where something upstream
(loading a level, spawning a player) had already asked for a shader on
some earlier frame, so the singleton already existed by the time this
function's fast path ran.
The SpriteBatch draw system is the first thing in a brand-new scene
that has nothing upstream of it — no mesh, no plain sprite entity, just
a bullet pool's one entity. On that scene's very first frame, its render
system is the very first caller of framer_shader_get_default() ever,
from inside a system, in a world where nothing has asked before. The
write lands; the read-back in the same call finds nothing; the function
returns 0; that frame renders every batch element with no shader bound at
all. The fix doesn't touch the ECS's timing at all, because there's
nothing wrong with it — it stops asking the world to hand back something
it was just told, seconds from now, to go store:
struct shader created = {.sprite_shader = sprite, /* ... */};

framer_component_set(world, FRAMER_ID(Shader), FRAMER_ID(Shader), &created);
return shader_of_type(&created, type);
Bug 3 (all three desktop backends): drawn correctly, in the wrong order
The first two bugs were both "nothing drew." The third one was quieter:
every bullet drew, at the right position, the right size, the right
texture — and the entity that fired them disappeared behind its own
bullets the moment enough of them piled up at its position.
SpriteBatch and the ordinary per-entity Sprite draw are two
separate systems in the same ECS phase, and nothing had ever said which
one goes first. On GBA and NDS this was never a question worth asking,
because the hardware answers it structurally: OAM sprites carry an
explicit priority value, and entity sprites are deliberately drawn at a
higher priority than batch elements, so an entity is in front of a batch
by construction, regardless of which system happened to run first that
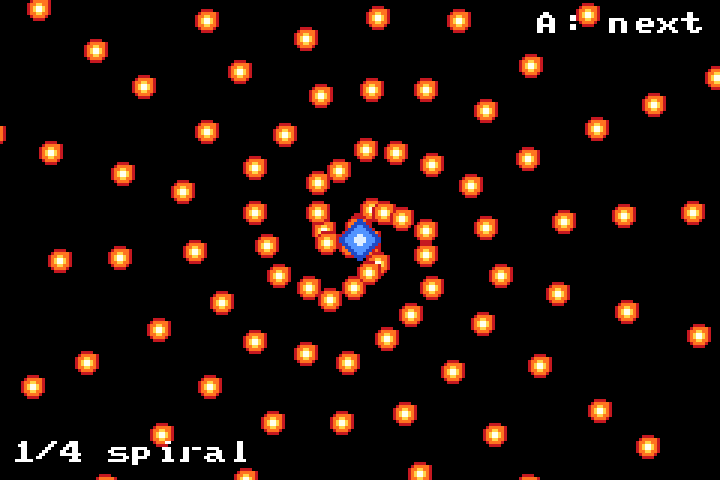
frame. Sampling the actual OAM contents through mGBA's debug stub, mid-run,
confirms it — the emitter (the round blue sprite at the center) sits
visibly in front of the spiral of bullets it just fired:
The three desktop backends (OpenGL, Vulkan, software) have no equivalent
hardware guarantee — draw order is the only ordering mechanism they
have — and the two systems simply registered in whatever order their
import code happened to call them, which put SpriteBatch after the
entity sprite system. Sampling actual framebuffer pixels at the emitter's
screen position, once every fifty frames of a real Vulkan run, shows
exactly the moment it stops working: the emitter's own blue for hundreds
of frames, then — once the bullet pool has enough live bullets to reach
that exact pixel — the pixel starts reading back as whatever bullet is
currently passing through it instead:
frame  350: 2850c8 5a96ff 5a96ff 5a96ff 2850c8   (emitter blue)
frame  750: 2850c8 5a96ff 5a96ff 5a96ff 2850c8   (emitter blue)
frame  800: c81e28 ff7828 ffdc50 ff7828 c81e28   (bullet red/orange)
frame 1200: c81e28 ffdc50 fffff0 ff7828 c81e28   (bullet, still)
The fix is the same one line of intent, spelled out explicitly instead of
left to registration order, on every desktop backend:
static const struct framer_system_dep batch_deps[] = {
    {.before = "sprite_render_system", .after = NULL}};

framer_system_register(world, "sprite_batch_render_system",
                        FRAMER_PHASE_ON_UPDATE,
                        sprite_batch_render_system, bq, batch_deps, 1);
A new renderer test pins this down the same way the fix does — a red
entity sprite and a white batch element occupying the same pixels, one
assertion that the pixel reads back red — so the ordering is now a
property the test suite checks rather than an accident of import order.
Verification: one bug per backend, so one check per backend
Nothing about the design change itself is backend-specific, so the actual
proof that the redesign works had to be, backend by backend, rather than
inferred from any one of them: the desktop pixel-readback tests
(software, OpenGL, Vulkan) each got their own pass through the same three
scenes, examples/bullets was cross-compiled for both GBA and NDS and
the resulting ROM's OAM contents were sampled through mGBA's debug stub —
the same technique the previous dithering article
used to catch its own hardware-only bug — and every GBA example ROM in
the tree was booted headlessly to confirm the pooled component-storage
change underneath all of this (a separate, smaller fix the redesign also
needed, since one more component pushed the fixed-stride storage layout
past EWRAM) didn't regress startup on anything else.
One number came out the same on every target it was checked on, which
wasn't the point of the exercise but is a reassuring sign the redesign is
actually target-neutral: with the pool's rotating spiral pattern running
continuously, the live bullet count settles in roughly the high 90s on
GBA, OpenGL and Vulkan alike, all three converging on the same rough
capacity for the same pattern despite three completely different drawing
paths underneath.
Where this goes next
FRAMER_STATIC_MAX_COMPONENTS (40) and FRAMER_STATIC_MAX_ENTITIES
(104, leaving 64 for actual game use) both grew slightly to make room for
the new component without pushing the pooled storage past EWRAM on GBA —
a two-line configuration change today, in a codebase where each of those
numbers has moved before and will again. The bullet-pool roadmap item
itself narrows to what's left once "draws correctly, everywhere" is no
longer the open question: measuring and documenting the actual per-target
bullet ceiling, rather than the two capacity constants
(examples/bullets currently uses 128 on GBA/NDS, 1024 on desktop)
picked ahead of having real numbers to size them against.
Introduction
The previous two articles on this blog — one on cycle-level
optimization, one on the no-heap ECS underneath it — were both about the Game Boy
Advance: an FPU-less CPU with no hardware polygon fill at all, where
every trick is about avoiding soft-float calls and touching as few VRAM
bytes as possible. The Nintendo DS backend in framer-engine
is the opposite kind of retro target — it has a real fixed-function 3D
GPU, with hardware transform, lighting, and rasterization. That sounds
like it should make lighting the easy part. It doesn't. It just moves
the constraint from "the CPU can't do float math" to "the GPU can't do
the thing you're asking it to do, and it won't tell you that — it'll just
render something else instead."
This article is about chasing exactly that down: a real rendering bug, a
real hardware surprise straight out of GBATEK, and a fix that gets
meaningfully closer to real point-light falloff without ever abandoning
the GPU's own lighting hardware for a software fallback.
Note
framer-engine is a personal side project. The source code will be
made publicly available once the engine reaches a sufficient level of
maturity.
The hardware constraint that drives everything
Every light in framer-engine — directional, point, or spot — is the same
struct light component, and every backend (GBA's software rasterizer,
desktop OpenGL/Vulkan/software, and this one) is expected to shade point
lights with real distance falloff: the closer an object is, the brighter
it gets, fading to nothing at the light's configured range. The DS's own
hardware lighting docs rule that out before any code gets written.
libnds's glLight():
void glLight(int id, rgb color, v10 x, v10 y, v10 z)
Only parallel light sources are supported on the DS
Four hardware light slots, each one a color and a direction vector — no
position, no range, no falloff term anywhere in the API. The DS's GPU
computes real per-vertex Lambertian shading (N·L) against those four
directions entirely in fixed-function hardware, at zero CPU cost per
triangle — genuinely excellent, for a directional light. A point light,
on this hardware, can only ever be an approximation: pick a direction,
accept that "distance" isn't a thing the lighting unit knows about, and
find whatever ways are still available to make that approximation better
without leaving hardware lighting behind entirely for a per-vertex
CPU-side shading pass (which the DS's ARM946E-S can do, but which throws
away the entire reason to use the GPU's fixed-function path in the first
place).
Bug 1: an ambient floor that was zero on purpose
Before any of the point-light work, the hardware 3D path had a simpler
problem: GL_AMBIENT — the DS's material property for "the color when
a face isn't catching any light at all" — was set to black,
unconditionally, the instant any Light entity existed in the scene:
/* what shipped, briefly */
glMaterialf(GL_AMBIENT, RGB15(0, 0, 0));
glLight() only lights a face whose normal faces toward one of the
four active directions — anything else gets zero contribution from
diffuse, and with GL_AMBIENT pinned to black, zero contribution from
ambient too. The result: any face pointing away from every active light
rendered as pure, flat black, on hardware that was otherwise correctly
shading everything facing the right way. The fix looked simple —
accumulate every ambient/directional light's color into a running sum
each frame, and feed that into GL_AMBIENT instead of a hardcoded
zero:
s_ambient_r += gl->r;
s_ambient_g += gl->g;
s_ambient_b += gl->b;
/* ...clamped to 1.0 after the loop, then: */
glMaterialf(GL_AMBIENT,
    RGB15((int)(r * s_ambient_r * 31.0f), /* ...g, b... */));
It rendered correctly with exactly one active light. It did not render
correctly with two.
The hardware surprise: ambient is summed once per active light
Adding a second point light to the scene — the natural next step, since
the whole point of this work was to support more than one — turned every
previously-correctly-shaded face white. Not brighter: blown-out,
clipped-to-white white, on geometry that had looked exactly right a
commit earlier.
The cause is in GBATEK's own description of the DS's polygon lighting
equation, easy to miss because nothing in libnds's glMaterialf() doc
comment mentions it: the hardware doesn't compute MaterialAmbient
once and add it to the final result. It computes MaterialAmbient ×
LightColor, separately, for every currently active light, and sums
those. Diffuse and specular are supposed to work that way — that's how
multiple colored lights are meant to combine — but ambient, conceptually,
is "the floor when nothing is lighting this face," and nothing about that
concept should scale with how many lights happen to be turned on. The DS
hardware doesn't make that distinction. Set GL_AMBIENT to the value
you actually want as a floor, and with three active lights, the hardware
hands you back three times that, added into every face's final color.
The first attempted fix was the obvious one: divide by the number of
active lights before setting GL_AMBIENT, so the hardware's own
summation would reconstruct roughly the intended value.
/* looked right, wasn't */
float ambient_scale = 1.0f / (float)s_num_lights;
This fixed the two-point-light overexposure. It also made a sphere lit by
one dim ambient light and two much brighter colored point lights render
far too dark — because a flat 1/N correction has no way to know that
those three active lights aren't equally bright. It divides down a lone
dim ambient contribution by exactly as much as it divides down two point
lights that have nothing to do with the ambient floor at all. A cube's
few flat faces happened to look fine anyway (whichever face caught a
point light's direction was still bright from diffuse); a sphere's curved
surface — mostly not facing any of the three light directions — was
left with almost nothing but that over-divided ambient term, and rendered
close to black again, just from a different arithmetic mistake than
bug 1.
The actual fix reconstructs the target ambient exactly, not
approximately: track the real per-channel sum of every active light's own
color (not just the count of lights), and divide by that instead.
/* MaterialAmbient * sum(LightColor) == target once hardware sums it
 * back, regardless of how many lights are active or how bright any
 * one of them is. */
float ambient_scale_r = 1.0f / fmaxf(s_light_color_sum_r, 0.05f);
glMaterialf(GL_AMBIENT,
    RGB15((int)(r * amb_r * ambient_scale_r * 31.0f), /* ...g, b... */));
Since MaterialAmbient × sum(LightColor) is exactly what the hardware
computes internally, setting MaterialAmbient = target / sum(LightColor)
makes the hardware's own summation land back on target — no matter
how many lights are active or how differently bright each one is. The
fmaxf(..., 0.05f) floor matters for a real edge case this reasoning
otherwise misses entirely: if every active light has an exact 0 in
one color channel (a pure-hue light, easy to reach — a pure green point
light has no red or blue component at all), the sum for that channel is
genuinely zero, and no MaterialAmbient value can make hardware
produce a nonzero result by multiplying against a color that has none.
Flooring the divisor doesn't fully fix that case — the DS hardware
mathematically cannot recover a floor for a channel no active light
contributes to — but it keeps the reconstruction from returning inf
and cascading into garbage the moment a scene reaches for a light whose
color isn't already a happy accident of "has something in every channel."
RGB555 has an opinion about how bright "bright enough" is
With the arithmetic fixed, faces pointing away from every light were no
longer wrong — just still visually indistinguishable from unlit black
in a real screenshot. RGB555 gives each channel 5 bits, 32 steps; a first
ambient floor of 0.18 on a 0.8-albedo material works out to roughly
0.8 * 0.18 * 31 ≈ 4/31 — technically nonzero, comfortably lost to
ordinary display gamma and contrast. Raising the floor to 0.45 reaches
roughly 11/31, about 35%: the difference between "the math is
correct" and "a person looking at the screen can tell the math is
correct." Getting the equation right and getting the number right turned
out to be two separate bugs, not one.
Real per-object falloff, without leaving hardware lighting
With the ambient floor actually behaving, the remaining problem was the
one this article opened with: point lights, as hardware directional
lights, weren't just "no falloff" in the abstract — the direction itself
was computed once per frame, not per object, from the world origin:
/* once per frame, not once per object */
float lx = gl->x, ly = gl->y, lz = gl->z; /* the light's position */
/* ...normalize (lx, ly, lz) as a direction from the origin... */
glLight(s_num_lights, hw_color, dx, dy, dz);
Every object in the scene, regardless of where it actually sat relative
to that light, saw the identical direction and the identical brightness,
with no falloff at all. A "point" light behaved exactly like a directional one
from every single object's point of view — which is a stronger
regression than the hardware's own real limitation demands. The DS
genuinely cannot do per-pixel or per-vertex-across-one-object falloff
for a point light; it can absolutely do a different, correct direction
and brightness for each separate object, if something recomputes those
per object instead of once for the whole frame.
That's the fix: move the glLight() upload from once-per-frame to
once-per-object, called right before that object's own triangles submit,
computing real direction and falloff from that object's actual world
position:
static void nds_upload_lights_for_object(const float pos[3])
{
    for (int i = 0; i < s_num_lights; i++) {
        /* ...ambient/directional lights reuse the once-per-frame
         * direction/color computed earlier -- no position to react
         * to, so recomputing per object would be pure waste... */
        float lx = gl->x - pos[0], ly = gl->y - pos[1], lz = gl->z - pos[2];
        float d2 = lx * lx + ly * ly + lz * lz;
        float atten = 1.0f - d2 * gl->inv_range2; /* same falloff every backend uses */
        /* ...clamp atten to [0, 1], normalize (lx, ly, lz), scale color by atten... */
        glLight(i, hw_color, dx, dy, dz);
    }
}
An object near the light now renders bright; an object near the edge of
its range renders dim; an object outside the range entirely gets nothing
from it — a real approximation of point-light falloff, per object,
running through the exact same hardware N·L diffuse calculation the
GPU always did. Nothing about the triangle count, vertex count, or
rasterization work changes even slightly — this only changes the
values written into two hardware registers that were already being
written once per object either way.
It isn't free in the sense of costing literally zero CPU cycles — a
point light's direction still needs a square root to normalize, and that
now happens once per (point light, object) pair instead of once per
frame. But it's the same fixed-point sqrtf32/divf32 primitives
this code already used for the once-per-frame version, on a scene with a
handful of lights and a handful of objects — a few extra fixed-point
operations, not a new soft-float cost, and not one more vertex for the
GPU to transform or one more pixel for it to fill. Against the cost of
submitting an object's actual geometry at all, it doesn't move the
needle, which is the only sense of "free" that was ever on the table for
a change like this.
Two smaller wins that came out of the same pass
Two more things fell out of looking this closely at the hardware
lighting path, neither one changing a single triangle:
GL_ANTIALIAS was already enabled at startup, and doing about half of
its job. The DS only blends an edge under antialiasing where the polygon
ID changes across it — and every object in the scene defaulted to the
same ID (0), so hardware edge smoothing only ever applied where an
object's silhouette met the background. Two overlapping objects, sharing
the same ID, got a hard edge between them regardless. Assigning each
object its own ID (an index mod 63, since glClearPolyID(63) reserves
63 for the backdrop) makes that blending apply between objects too — a
different bitmask, OR'd into a glPolyFmt() call that already happens
once per object, at the same cost as before.
And the built-in sphere/cone mesh, generated at 12 sectors × 6 stacks
(120 triangles), was sized for a target this GPU isn't. That segment
count lives in a comment noting the DS's real per-frame budget is "on the
order of a couple thousand polygons" — a 360-triangle sphere at 20×10 is
still a rounding error against that, and visibly rounder on screen, for a
target whose real constraint was never triangle count in the first
place.
Update: the tessellation win had a hidden cost
That "visibly rounder on screen" sphere from the section above had a
cost this article didn't account for at the time. examples/lighting
quietly ran at exactly 30fps on real NDS timing (melonDS) rather than
60, and the cause traced straight back to this same pass.
nds_submit_tri() — the function issuing each triangle's vertices —
was also where every triangle's GL_AMBIENT/GL_DIFFUSE material
state got (re)computed, including the full ambient-reconstruction
division this article spent three sections on above. For a single-color
object that's pure waste: the material state is identical across every
one of an object's triangles, so it only ever needs setting once per
object, not once per triangle. A 12×6 (120-triangle) sphere issued 120
redundant glMaterialf() pairs into the GX FIFO every frame even
before this article's own change; the same sphere at 20×10 (360
triangles, the tessellation bump described above) issued 360. Combined
with the lighting example's four active lights — each one re-triggering
that same reconstruction math on every single one of those calls — frame
time crept just past one VBlank period.
swiWaitForVBlank() doesn't degrade gracefully when that happens. It
waits for the next VBlank interrupt after the frame's work completes,
full stop — there's no "a little late" state between VBlanks, only "made
it" or "missed it and now wait for the one after." Missing a single
VBlank by any margin, even a fraction of a scanline's worth of GX FIFO
backlog, halves the observed frame rate outright: 60fps to exactly
30fps, not 59 or 58. The tessellation bump didn't cause a gradual
slowdown that could be spotted incrementally — it silently sat under the
VBlank deadline until it didn't, and the frame rate cut itself exactly
in half the moment it crossed.
The fix has nothing to do with tessellation, lighting, or the ambient
math itself — all of that stays correct, unchanged. It's purely a matter
of when the material state gets written: once per object (or once per
face, only for the rare object whose faces genuinely have different
colors), immediately before that object's triangles submit, instead of
redundantly with every single triangle. The exact same
GL_AMBIENT/GL_DIFFUSE values land on the GPU either way — this
changes nothing about what gets drawn, only how many times the identical
FIFO command gets issued to say so.
This doesn't extend to the GBA backend: its software rasterizer computes
each face's final color directly in gba_lit_color_face(), with no
separate material/normal GPU state to redundantly reissue in the first
place — there's no equivalent waste to hoist out over there.
Confirmed on real timing (melonDS): back to a solid 60fps. The
underlying shape of the bug is the same one this whole article is
about — a GPU that will happily do exactly what's asked of it, at
whatever cost that actually carries, and won't warn you when two
separately reasonable changes (a rounder sphere, correct per-object
point-light falloff) compound into a cost neither one would have caused
alone.
Verifying a change with nothing to count
The GBA articles on this blog leaned on cycle_probe.py for every
claim — a deterministic emulator's own cycle counter, diffed between
frames, turning "did this help" into a yes/no number. None of that
tooling applies here, and that's not an oversight: this whole article is
about work that happens on the GPU's fixed-function pipeline, not the
ARM9's own cycles. There's no CPU-side cost to isolate with a breakpoint,
because there almost isn't one — the actual verification for this kind
of change is the build and test suite (native, GBA, and NDS cross builds,
all passing unchanged throughout), plus looking at the actual rendered
frame in melonDS to confirm the sphere in examples/lighting is now
visibly shaded by two differently-colored, differently-positioned lights
instead of one flat approximation. Different kind of hardware, different
kind of proof.
Where this goes next
The DS's fixed-function GPU has real capabilities this backend still
doesn't touch at all: hardware texture sampling from VRAM, a specular
shininess table, per-vertex fog. None of those are CPU-cost questions —
they're GPU features sitting unused, the same shape of opportunity this
article's point-light work turned out to be. The natural next piece,
given how this one went, is real diffuse texturing: the highest-value use
of hardware this backend doesn't ask anything of yet, and — if the
pattern from the ambient bug repeats — probably has its own GBATEK
surprise waiting to be found the same way this one was, by trying the
obvious thing first and actually looking at what came out the other end.