Introduction
The earlier article on cycle-level GBA optimization
covered the software 3D rasterizer, where two "obviously correct" changes
measured as regressions once link-time optimization's inlining was counted.
Here the same thing happens in the text renderer, with two more wrong turns
that have nothing to do with LTO.
Note
framer-engine is a personal side project. The source code will be
made publicly available once the engine reaches a sufficient level of
maturity.
Two framer-engine examples with a lot of on-screen text ran far below
the 60 Hz target, both idle, nothing moving, no input needed to reproduce:
input_tester (76 of a 96-slot text sprite budget active) at roughly
18 FPS, and wordle, a word cloud of rotated labels, at roughly 14.5.
phase_probe.py, the gdbstub cycle-bracketing script used in earlier
articles, put about 69% of a frame's cost inside one function,
gba_text_render_system. Which part of it?
Finding where the cost lives
The function processes a handful of text entities, each with one or more
lines, each line made of several hardware sprites (one GBA OAM entry per
glyph group). Three plausible places for the cost to hide: the glyph
layout math, the screen-space projection that turns a world position into
a pixel coordinate, or the OAM attribute writes themselves, once per
glyph and so the most frequent of the three.
arm-none-eabi-objdump -dS ruled out the OAM writes: they are inlined
integer stores with no library calls. The projection math was different:
cx/cy (an entity's anchor in screen space) and py_base/px
(where each line starts) were float, and the ARM7TDMI has no FPU, so every
subtract, add, multiply, floorf() and float-to-int conversion goes
through a software float routine.
Static inspection shows that a call exists, not how often it runs. Two
breakpoints measured that: one at the function's entry, one at the first line
of the innermost per-sprite loop body. The delta between consecutive hits of the second breakpoint is one
sprite's own cost when it stays on the same line as the sprite before it,
and the same delta plus a line's or entity's own setup when it doesn't.
In a steady frame of input_tester, a same-line sprite-to-sprite step
cost about 515 cycles. A step that also crossed into a new line or a new
entity cost 7400 to 17000, roughly fifteen times as much. Those transitions are
rarer than sprites but frequent enough to dominate a frame. The per-entity and
per-line projection math was the cost, not the per-sprite work.
Attempt 1: fixed-point that rounded the wrong way
The engine's software 3D pipeline already uses fix_t, a Q12 fixed-point
type, where one hardware multiply (fix_mul) replaces a chain of soft-float
calls. Reusing it for text looked like the obvious fix: convert the camera
position, ortho extent, scale and entity position to fix_t and project in
integer math.
It looked right in every example. Before trusting that, I wrote a host-side
sweep test comparing the fixed-point result with the float one across a grid
of realistic camera, ortho, scale and position values. 16 of 192 combinations
disagreed, every one by exactly one, in the same direction:
mismatch: cam=0.0 ortho=5.0 scale=28.8 pos=0.0 expected=144 actual=143
mismatch: cam=0.0 ortho=5.0 scale=28.8 pos=2.5 expected=72  actual=71
The existing fix_from_float() helper (shared with the 3D rasterizer,
which depends on its exact behavior) truncates toward zero. Four
conversions chained together — camera, ortho extent, scale, position —
each truncate a little short, and on values that land exactly on an
integer in float math, the accumulated shortfall floors to one below the
right answer. Text at 144.0 pixels would have shifted by a pixel on specific
camera positions, with no visible sign.
Attempt 2: the float path that measured slower
Instead of fixing the rounding, I kept everything in float and replaced
(int)floorf(x) with a hand-rolled version. objdump showed the
floorf() body at 74 instructions, handling NaN, infinity and subnormals
that bounded screen-space input never produces. A truncate-then-adjust
version is exact for any finite value and looks much cheaper:
static inline int gba_fast_floor(float x)
{
    int i = (int)x;
    return (float)i > x ? i - 1 : i;
}
It is exact, verified like the first attempt, and shorter. cycle_probe.py
disagreed: the steady-state average on input_tester went from 727556 to
748028 cycles/frame, a ~2.8% regression. The original (int)floorf(x) is
two soft-float calls (floorf, then the float-to-int conversion). The
replacement is three (truncate, convert back to float, compare), and each call
pays its own call/return/Thumb-interworking overhead. floorf()'s large
body is cheaper than one extra call.
What actually worked
Fixed-point, with the rounding fixed: a local gba_fix_from_float_rounded()
that rounds to nearest. The shared fix_from_float() stays untouched because
the 3D rasterizer depends on its truncation. The sweep test now passes,
including the exact-integer cases and the narrowest float margin around an
integer boundary.
The second change mattered as much: every frame-constant term (camera
position, ortho extent, screen-space scale) is converted to fix_t once per
call, not once per entity. Only the entity's own position is converted per
entity. fix_mul is one hardware multiply, and flooring a fix_t to a
pixel coordinate is an arithmetic right shift, with no library call.
A rotated text entity still needs a float cx/cy for the sprite-rotation
math. Computing it from scratch next to the fixed-point version made a rotated
entity pay for both, which was slower than before for that case;
cycle_probe.py on wordle's word cloud confirmed it. Deriving the float
value from the fix_t one (one int-to-float conversion and a multiply by a
constant) halved that overhead. A rotated entity still computes both.
Checking it
Cycle counts do not show correctness, and a projection rewrite can be off by
one pixel without looking wrong. The check is the flicker article's OAM sampling, made byte-exact: connect to the emulator's
GDB stub, let a few frames pass so startup settles, read the 1 KB of hardware
sprite memory, and compare it with the same read from the unmodified ROM.
IDENTICAL: 1024 bytes of OAM match exactly
This holds for both input_tester (unrotated text) and wordle
(rotated): all 128 sprite entries have the same position, tile, palette bank
and affine flags in both ROMs.
The numbers
Steady-state averages, cycle_probe.py against framer_gba_wait_vblank:
| Example |
Before |
After |
Change |
|---|
| input_tester (unrotated text) |
~684800 cycles/frame |
~660650 cycles/frame |
~3.5% faster |
| wordle (rotated word cloud) |
~810400 cycles/frame |
~814470 cycles/frame |
~0.5% slower |
input_tester is the representative case: a HUD-style scene with static,
unrotated labels. wordle's word cloud is a rotation showcase and the one
case where the change gives a little back. Closing that gap would need two code
paths, fixed-point when nothing is rotated and float when something is. I did
not add them: more branching in a dense function, for a demo scene rather than
the 18 FPS HUD case.
What is left
~3.5% is not the fix for an 18 FPS scene. The per-entity layout call and
framer_color_bank_acquire() were never bracketed like the projection math,
and either may hold more cost. Next step: the same two-breakpoint measurement
on them.
Introduction
The GBA cycle-level optimization article and the
one on faking point lights on the DS GPU share a
premise: these CPUs have no floating-point unit, and every vertex costs
something somewhere. The GBA pays in rasterizer cycles. The DS has a hardware
3D engine, so it pays elsewhere, in a part of the frame I had not looked at.
Note
framer-engine is a personal side project. The source code will be
made publicly available once the engine reaches a sufficient level of
maturity.
The framer-engine spinning_shapes example puts a cube, a sphere and
a cone on screen, each rotating, and a button toggles between drawing them
solid and drawing them as wireframes. On the DS it ran at 60 FPS in solid
and about 20 in wireframe. Wireframe should be cheaper: fewer pixels filled,
no lighting. The bug report was that a debug view ran three times slower than
the real thing. A second question followed: how do you measure a frame on a
platform you can only run in an emulator?
How wireframe gets drawn on a GPU that has no lines
The DS 3D engine draws triangles and quads, and nothing else:
libnds' glBegin() takes only triangles and quads (and their strips), with
no line primitive. The hardware has a wireframe polygon mode, selected by a
polygon alpha of zero, but it outlines a polygon's own edges. The engine's
meshes keep a separate list of the edges to draw, and for a sphere that list
leaves out the diagonals that split each patch into two triangles; the
hardware mode would draw them. (I reasoned this out and never tried the mode.)
So wireframe here is a thin, flat, unlit quad along every edge.
The quad has to be widened perpendicular to the edge, in a direction that
makes sense for a convex mesh centered on its origin. The code takes the
direction from the origin to the middle of the edge and removes the part along
the edge:
/* per edge, every frame */
float edge_len = sqrtf(edge[0]*edge[0] + edge[1]*edge[1] + edge[2]*edge[2]);
float mid_len  = sqrtf(mid[0]*mid[0] + mid[1]*mid[1] + mid[2]*mid[2]);
dir[k]    = edge[k] / edge_len;          /* k = 0..2 */
radial[k] = mid[k]  / mid_len;
dot       = radial[0]*dir[0] + radial[1]*dir[1] + radial[2]*dir[2];
width[k]  = radial[k] - dot * dir[k];    /* perpendicular to the edge */
width_len = sqrtf(width[0]*width[0] + width[1]*width[1] + width[2]*width[2]);
width[k]  = width[k] / width_len * half_width;
/* then four vertices: a -/+ width, b +/- width, as 4.12 fixed point */
On a PC this is unremarkable. On the DS's ARM9 it is three square roots, nine
divides, roughly fifty multiplies and adds and twelve float-to-fixed
conversions per edge, every frame, each a call into a software
floating-point routine.
Why not just look at the frame rate
Reading the emulator's frame counter tells you least. melonDS' speed varied a
lot between runs in earlier sessions, so wall-clock time and its frame counter
say more about the host than the console. The emulated hardware timers hold
still: the same ROM executes the same instructions and the timers count them
the same way every run.
libnds exposes two of them chained into a 32-bit counter through
cpuStartTiming() and cpuEndTiming(), which return ticks of the
hardware timer clock (about 33.5 MHz, the bus clock; the ARM9 itself runs
at twice that). A throwaway build wraps the 3D render system and stores the
result in a global per render mode:
volatile uint32_t g_diag_ticks[2];   /* [0] solid, [1] wireframe */
volatile uint32_t g_diag_count[2];

static void nds_hw3d_render_system(framer_iter_t *it)
{
    int w = framer_render_mode_get_override() ==
            FRAMER_RENDER_MODE_FORCE_WIREFRAME;

    cpuStartTiming(0);
    nds_hw3d_render_system_impl(it);   /* the real system, unchanged */
    g_diag_ticks[w] = cpuEndTiming();
    g_diag_count[w]++;
}
A copy of the example toggles the render mode itself every 120 frames, so
one emulator launch produces both numbers, and the globals are read over
melonDS' GDB stub, with their addresses taken from nm on the ARM9 ELF:
ticks = struct.unpack('<2I', bytes(rsp.read_mem(sock, tick_addr, 8)))
count = struct.unpack('<2I', bytes(rsp.read_mem(sock, count_addr, 8)))
Two runs agreed to within a few ticks, which makes the figures usable:
| Mode |
Ticks per frame |
Time |
|---|
| Solid |
317,950 |
9.5 ms |
| Wireframe |
1,414,850 |
42 ms |
A 60 FPS frame is 16.7 ms. Solid fits with room to spare. Wireframe takes
42 ms in the 3D pass alone, more than two vertical blanks, so the frame lands
on the third and the screen updates every 50 ms: 20 FPS.
Where 1.4 million ticks go
The meshes are not small. The sphere has 20 sectors and 10 stacks, which is
430 edges and 360 triangles; the cone adds 40 edges and 40 triangles and
the cube 12 and 12. A wireframe frame therefore builds 482 quads, and a
solid frame submits 412 triangles. Dividing:
- wireframe: 1,414,850 / 482, about 2,900 ticks per edge, roughly 5,900
ARM9 cycles for the arithmetic above;
- solid: 317,950 / 412, about 770 ticks per triangle, which is a normal and
three vertices converted to fixed point and handed to the GPU, with no
square root and no divide anywhere in it.
The GPU did not set the cost in either mode. The CPU did, and in wireframe it
spent 42 ms of every frame, two and a half frame budgets, on arithmetic whose
answer is the same every frame.
The data never changes
The cube is the same cube every frame. Only the model matrix changes, and the
GPU applies that itself from a matrix stack. Every square root and divide in
that loop recomputes the same four vertices as 1/60th of a second earlier.
The DS has a mechanism for exactly this: a display list, a block of
pre-packed geometry-engine commands that glCallList() sends to the GPU
FIFO by DMA. Its layout is the hardware's own FIFO layout, documented in
GBATEK: a first word with the number of words that follow,
then groups made of one word holding up to four command ids, one per byte,
followed by the parameter words of those commands in order. A quad with
four vertices comes out as:
word 0   count
word 1   BEGIN_VTXS | VTX_16 | VTX_16 | VTX_16     (0x23232340)
word 2   1                                          (GL_QUADS)
word 3   x0 | y0 << 16                              vertex 0
word 4   z0
word 5   x1 | y1 << 16                              vertex 1
word 6   z1
word 7   x2 | y2 << 16                              vertex 2
word 8   z2
word 9   VTX_16 | NOP | NOP | NOP                   (0x00000023)
word 10  x3 | y3 << 16                              vertex 3
word 11  z3
The packer is about eighty lines of plain C with the command ids defined next
to it (BEGIN_VTXS is 0x40, NORMAL 0x21, VTX_16 0x23). It has no
libnds dependency, so it is unit-tested on the desktop, with the layout above
as one test. libnds documents one trap: END_VTXS does nothing and is
reported to cause trouble in a DMA'd list, so lists never contain it.
void gx_dl_cmd(struct gx_dl *dl, uint8_t id, const uint32_t *params, int n)
{
    if (dl->slot == 4) {                 /* open a new command word */
        dl->cmd_at = dl->len++;
        dl->words[dl->cmd_at] = 0;
        dl->slot = 0;
    }
    dl->words[dl->cmd_at] |= (uint32_t)id << (8 * dl->slot);
    dl->slot++;
    for (int i = 0; i < n; i++)
        dl->words[dl->len++] = params[i];
}
The renderer bakes a mesh the first time it is drawn in a given mode: the
edge quads for wireframe, the triangles with their flat normals for solid.
After that a draw is a colour, a glCallList() and nothing else. Only
what is identical on every draw goes into a list; the colour, the
material, the polygon format and the model matrix stay with the caller, so
the same list serves every object that shares a mesh. Two kinds of object
keep the old triangle-by-triangle path because they vary something a list
would have to hold: objects with a colour per face, since the material
changes between faces, and textured ones, since their texture coordinates
are scaled by the texture's size. The old immediate wireframe code also
stays, as the fallback for a mesh that cannot be baked: more than eight
different meshes in a program, or no memory left for the list.
Results
Same scene, same instrumented build, measured the same way:
| Mode |
Before |
After |
Change |
|---|
| Solid |
317,950 |
18,500 |
17 times cheaper |
| Wireframe |
1,414,850 |
24,450 |
58 times cheaper |
The wireframe pass goes from 42 ms to 0.73 ms and solid from 9.5 ms to
0.55 ms. The two modes now cost about the same, which is what the original
bug report had assumed all along.
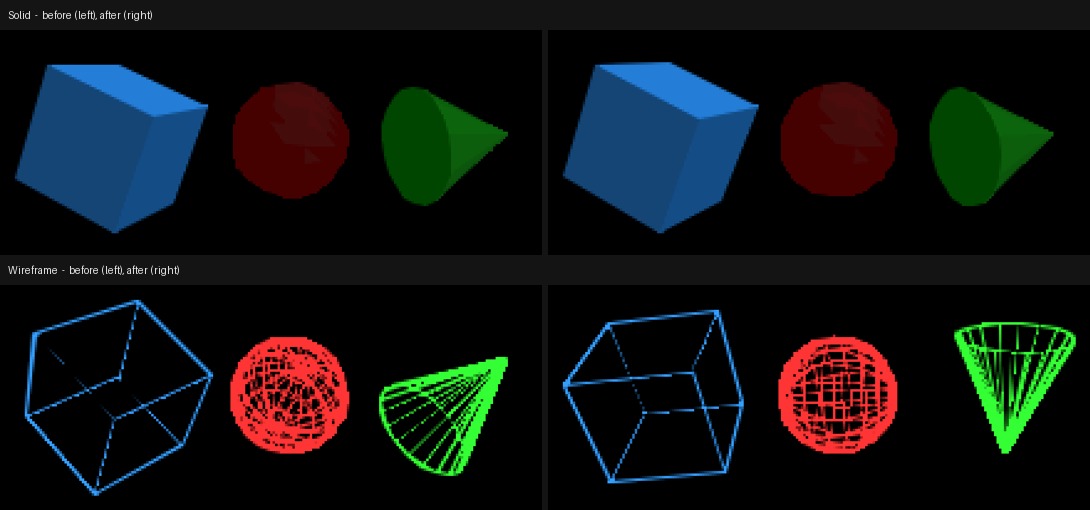
The picture must stay the same. The figure shows the top screen before and
after, captured in the same runs as the numbers. The shapes are at different
points of their rotation because the demo keeps spinning; shading and lines
are the same.
Three caveats:
- The GPU still has to consume the list. glCallList() flushes the
list from the data cache, starts the DMA and waits for it to finish, and
the DMA only completes once the geometry FIFO has accepted the data. melonDS
models the geometry engine's timing only roughly, so on a real console
that wait will be longer than 0.7 ms. It is waiting on the GPU, not
computing, and nothing was measured on real hardware.
- The first draw pays the old price once. Baking runs the original math
one time per mesh and mode, so the first frame in wireframe still does
what every frame used to. It is a one-off hitch rather than a rate, and
an unmeasured one.
- Lists cost memory. About 15 KB for the sphere's wireframe and 12 KB
for its solid list, allocated from the heap and held for the life of the
program.
What is still on the slow path
Objects with per-face colours and textured objects still submit triangle by
triangle, so a scene dominated by them gets none of this. Both can be baked: a
per-texture-size list for the textured case, one list per colour run for the
face-coloured one. They are next, measured the same way.
Introduction
framer-engine is a small cross-platform ECS game engine I am building, with
backends from desktop OpenGL/Vulkan down to bare software rendering on 8/16-bit
consoles. The Game Boy Advance backend renders textured and shaded 3D meshes
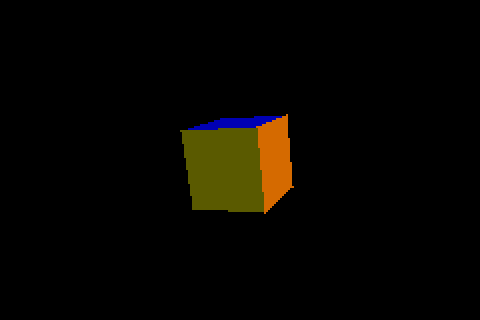
(cubes, cones, spheres) through a CPU-only software rasterizer on a 16.78MHz
ARM7TDMI with no FPU and no hardware polygon fill. Every float operation
and every divide is a library call, and every pixel is a CPU read-modify-write
into VRAM.
Note
framer-engine is a personal side project. The source code will be
made publicly available once the engine reaches a sufficient level of
maturity.
Every number below comes from scripts/debug/gba/cycle_probe.py, a script
that sets a breakpoint on the engine's vblank-wait function inside headless
mGBA and reads the emulator's cycle counter on every hit. mGBA's CPU
emulation is deterministic: the same ROM with the same inputs gives
bit-identical cycle counts every time, so a claim is "frame N now costs X fewer
cycles", not "it looked smoother". I discard the first ~100 frames as warm-up
(caches, lazy first-frame setup) and average the steady-state window after
that.
That discipline matters more than any single trick below, because twice an
optimization that was obviously correct measured as a regression. Those
are at the end.
The hardware constraint
The GBA display is locked to the LCD's scanout rate. A frame takes 280896
system clock cycles to display whether or not your CPU work fits in it. If it
does not, you display every other frame or worse, and the frame rate quantizes
to 59.73 / n for whatever integer multiple of the budget a frame costs.
There is no GPU to defer to and no graceful way to miss the deadline. The goal
is a CPU-side frame cost under, or close to, 280896 cycles.
Two limits drive every technique:
- No FPU. Any float/double multiply, divide, sqrtf(),
sinf()/cosf()/tanf() compiles to a call into ARM's soft-float
runtime: a function call plus a software algorithm per operation.
- No hardware rasterizer. Mode 4's bitmap layers are VRAM written by the
CPU. Every pixel a triangle covers is computed and stored by the ARM7TDMI.
Technique 1: fixed-point math instead of float
The most basic change: the hot path (per-vertex transform, per-pixel
rasterization) uses Q12 fixed-point integers through a small fix_t type
(src/backends/renderer/common/sw3d_fixed.h):
typedef int32_t fix_t;

#define FIX_SHIFT 12
#define FIX_ONE   (1 << FIX_SHIFT)   /* 4096 == 1.0 */

static inline fix_t fix_mul(fix_t a, fix_t b)
{
    return (fix_t)(((int64_t)a * (int64_t)b) >> FIX_SHIFT);
}
The int64_t intermediate looks expensive, but on ARM it lowers to a single
hardware SMULL (signed multiply, 64-bit result), with no library call. A
float * float on this target is a soft-float call doing mantissa and
exponent bookkeeping in software.
Division still hurts, because the ARM7TDMI has no hardware divider either way:
a fixed-point divide costs an integer library call (__aeabi_idivmod and
friends) instead of a float one. The perspective divide exploits a property of
that specific division to cut the cost:
/* fix_div()'s general implementation widens to a 64-bit intermediate to
 * stay correct for arbitrary numerators, but the perspective divide's
 * numerator is always FIX_ONE, so FIX_ONE << FIX_SHIFT never exceeds
 * 32 bits. */
static inline fix_t fix_reciprocal(fix_t b)
{
    return (fix_t)(((int32_t)FIX_ONE << FIX_SHIFT) / b);
}
Replacing the general 64-bit fix_div() with this 32-bit reciprocal at the
one call site whose numerator is always FIX_ONE saved ~50,000 cycles/frame
on examples/spinning_shapes.
Technique 2: a LUT instead of sinf()/cosf()
framer_transform_get_matrix(), the shared cross-platform transform code,
builds rotation matrices with cglm's glm_rotate_{x,y,z}(), which call
cosf()/sinf(). On desktop that is a couple of FPU instructions. On the
GBA it is a soft-float libm round trip per axis, per object, per frame.
The GBA backend carries its own 256-entry sine table (sw3d_raster.c),
reads cosine from the same table at a quarter-turn offset, and interpolates
linearly between samples:
static const fix_t gba_sin_lut[256] = { /* ... */ };

static void gba_fast_sincosf(fix_t angle_turns_256, fix_t *s, fix_t *c)
{
    int idx = angle_turns_256 & 0xff;
    int cidx = (idx + 64) & 0xff; /* cos(x) == sin(x + tau/4) */

    *s = gba_sin_lut[idx];
    *c = gba_sin_lut[cidx];
}
256 entries is ~1.4° between samples, far finer than a 240x160 screen shows, so
the interpolation error never appears as jitter. Swapping it in for the float
sin/cos chain, measured A/B (git stash plus identical build and measure
commands) on spinning_shapes (3 objects rotating on all 3 axes every
frame): 1,294,320 → 1,234,341 cycles/frame, ~4.6% less, from removing one
class of soft-float call.
A follow-up went further. cglm builds the rotation matrix with up to three
generic 4x4 matrix multiplies, one per nonzero Euler axis, each a 64
multiply-add matmul although most entries of a pure-axis rotation matrix are 0
or 1. Instead, the 9 nonzero 3x3 entries of the combined Rz·Ry·Rx product
are expanded by hand from the three angles' sin/cos (still from the LUT) and
folded into the output with one glm_mat4_mul:
/* out = Rz * Ry * Rx, 9 nonzero entries expanded by hand instead of
 * three generic 4x4 matmuls. */
out[0][0] = cy * cz;
out[0][1] = cy * sz;
out[0][2] = -sy;
out[1][0] = sx * sy * cz - cx * sz;
out[1][1] = sx * sy * sz + cx * cz;
out[1][2] = sx * cy;
out[2][0] = cx * sy * cz + sx * sz;
out[2][1] = cx * sy * sz - sx * cz;
out[2][2] = cx * cy;
I verified it against the three-matmul path with NumPy differential tests over
all 8 zero/nonzero axis combinations and thousands of random angle triples (max
absolute error ~1e-16) before it touched the renderer. The gain was only
1,309,080 → 1,306,224 cycles/frame, ~0.22%, far less than the operation
count suggests, because the optimizer already folds away most of the zero and
one multiplies when each Rz/Ry/Rx factor starts from an
identity-seeded matrix. Hand-expanding math only pays once you have checked
what the compiler already does. A branch-free variant that skipped the matrix
multiply altogether (translation column copy plus per-column scale) measured
worse in every iteration than this one-matmul version, and I discarded it.
Technique 3: Quake III's fast inverse square root
Triangle shading needs each surviving triangle's world-space normal,
normalized, once per shaded triangle per frame, in the renderer's hottest loop.
cglm's glm_vec3_normalize() calls sqrtf() and divides by the result:
two soft-float calls per triangle.
The fix is the well-known bit-hack:
static float sw3d_fast_inv_sqrt(float number)
{
    union { float f; uint32_t i; } conv = { .f = number };

    conv.i = 0x5f3759df - (conv.i >> 1);
    conv.f *= 1.5f - (0.5f * number * conv.f * conv.f); /* one Newton-Raphson step */
    return conv.f;
}
A magic-constant shift gives a rough inverse square root straight from the
float's IEEE bit pattern, with no sqrt call, and one Newton-Raphson step
sharpens it until it is visually indistinguishable for lighting. It replaces
both the sqrt and the divide at every site in the GBA backend that called
glm_vec3_normalize() (face-normal lighting in the renderer and the
rasterizer's triangle-normal centroid computation), removing two soft-float
calls per triangle.
Technique 4: an ECS dispatch early-out
Not every win is in the renderer. framer_world_progress(), the ECS
scheduler's per-frame loop, walked every registered system's full entity range
every frame, including systems whose query needs a component type that no
entity in the scene has ever had. simple_cube registers
collider/velocity/rigidbody systems on every platform (component import is
unconditional), so most systems scanned entities every frame to match none.
The fix tracks a sticky OR of every component bit ever set in the world and
skips a system's scan entirely, in O(1) with no entity walk, when its query's
required mask includes a bit outside that set, since it can never match:
/* s_any_mask: sticky OR of every component bit ever set across the
 * world's lifetime. A query whose mask requires a bit outside this set
 * can never match any entity — skip the per-entity scan entirely. */
if ((q->mask & world->s_any_mask) != q->mask)
    continue;
This is the largest single win in the project: simple_cube 308650 →
288629 cycles/frame, spinning_shapes 757806 → 744701 cycles/frame
(steady-state averages over frames 101-150). It is a scheduler fix, not a
renderer trick, found the same way: measure where the cycles go.
Technique 5: making divides Bresenham-shaped
The scanline rasterizer (sw3d_fill_triangle()/sw3d_fill_quad())
originally tested every pixel in each triangle's bounding box against all three
edge functions. The replacement computes each row's [lo, hi] x-span per
edge, incrementally. That is Bresenham's line algorithm applied to "x as a
function of y" along a triangle edge:
/* Incrementally tracks bound(y) = floor((b0 + (y - y0) * d) / a) for a
 * fixed positive `a`, one row at a time, with zero divisions after
 * init. The GBA's ARM7TDMI has no hardware divider, so trading one
 * division per edge (at init) for what used to be a same-sign test on
 * every bounding-box pixel is the whole point. */
struct row_bound {
    long val, step, rem, err, a;
};
"One division-equivalent test per candidate pixel" becomes "one division per
triangle edge plus an integer add per row", a large change on a CPU with no
divider.
It also produced an unusual micro-optimization. The one division still needed
per edge (floordiv_pos()) is built on a / b and a % b in C, which
GCC should fuse into a single __aeabi_idivmod call. Disassembly showed the
fusion on one branch (a > 0) but not the other (a < 0, which negates
both operands first): a redundant __aeabi_idiv next to the
__aeabi_idivmod for the same division. Restructuring the C source gave
byte-identical codegen, so I could not fix it from the C side. The fix is to
call the library function directly and unpack its packed 64-bit r0:r1
quotient/remainder by hand, so the compiler cannot make the wrong fusion
choice:
extern long long __aeabi_idivmod(long numerator, long denominator);

static long floordiv_pos(long a, long b)
{
    long long qr = __aeabi_idivmod(a, b);
    long q = (long)(uint32_t)qr;
    long r = (long)(qr >> 32);

    if (r != 0 && a < 0)
        q--; /* C truncates toward zero; floor() needs a -1 correction */
    return q;
}
This saved roughly 25,000-30,000 cycles/frame on spinning_shapes, by
removing one redundant library call on one branch that no compiler flag could
remove.
Technique 6: let the hardware scale a smaller image
The GBA has no hardware polygon fill, so every covered pixel is a CPU
read-modify-write into VRAM. That is the floor under every other optimization
here: once every avoidable divide and float operation is gone, you are still
bound by how many pixels the CPU touches.
The way around it is not a CPU optimization. Mode 4's BG2 layer supports affine
transforms even though it is a flat bitmap, the trick behind GBA games that
faked SNES Mode 7 scaling. The renderer draws only a 120x80 corner of the
framebuffer (a quarter of the 240x160 screen's pixels) and BG2's affine matrix
stretches it across the screen at scanout, in hardware, at no CPU cost:
#if GBA_RENDER_SCALE == 1
static inline void gba_clear_buffer(vu16 *base) { /* full-res clear */ }
#else
static inline void gba_clear_buffer(vu16 *base)
{
    /* only clear the GBA_RENDER_WIDTH x GBA_RENDER_HEIGHT corner that's
     * actually sampled by BG2's affine matrix — the rest of the page is
     * never displayed, so clearing it is wasted work. */
}
#endif
On spinning_shapes this took the steady-state cost from ~1.55M to ~1.28M
cycles/frame, roughly 10.8fps → 13.1fps, ~17% less, at the price of
visibly blockier 2x nearest-neighbor edges. It is opt-in (-Dgba_half_res),
because unlike every other technique here it is a visible quality trade, not a
free win.
How the measurements work
None of the numbers above are estimates. scripts/debug/gba/cycle_probe.py
drives headless mGBA, breaks on the engine's vblank-wait call (the one point
every frame passes through exactly once), and reads the emulator's cycle
counter on every hit. mGBA's CPU core is deterministic, unlike real silicon, so
the same ROM, breakpoint and warm-up discard give bit-identical cycle counts
on every run. "Did this help?" becomes a yes/no question: rebuild, re-run the
probe, diff the number.
That is also what caught the two optimizations that were obviously correct and
were not.
Failed attempt 1: caching screen-space half-extents that never change
The camera's screen-space half-width and half-height, once converted to
fixed-point, do not change from frame to frame unless the projection changes.
Hoisting the conversion out of the per-vertex projection loop and caching it
looked like a free win: same values, computed once instead of once per vertex.
It measured as a regression.
The likely cause, from inspecting the generated assembly: the project builds
with link-time optimization (LTO) and -Doptimization=3, and LTO's inlining
heuristics are sensitive to function and loop size in ways the C source does
not show. A cache check, even a cheap one, in an already-hot inlined loop
changed the cost/benefit the inliner used elsewhere in the same translation
unit, and the loss of more valuable inlining outweighed the arithmetic saved.
The hoist was right about the math and wrong about the measured outcome.
Failed attempt 2: skipping integration work for a zero velocity
The same thing happened independently in velocity_integration_system().
Most entities in simple_cube have a Velocity that is exactly zero every
frame. A zero-vector early-out before the glm_vec3_scale/glm_vec3_add
calls is mathematically a no-op, so it looked like free cycles for every
entity that was not moving:
/* tempting, and wrong on this build */
if (glm_vec3_isvalid(v->linear) && glm_vec3_norm2(v->linear) == 0.0f &&
    glm_vec3_norm2(v->angular) == 0.0f)
        continue;
Measured: +112 cycles/frame on simple_cube, +312 on spinning_shapes, a
regression from a change with no behavior difference. Same root cause: the
early-out added code size and a branch to a hot loop, LTO's inlining shifted,
and the inlining lost elsewhere cost more than the skip saved. I reverted it in
the same session.
The takeaway is not that loop-invariant hoisting or early-outs are untrustworthy;
both are standard and usually right. Once a build relies on LTO and aggressive
optimization levels, the compiler's decisions are part of the system you are
optimizing, and they do not always move the way your model of the code
predicts. The only check is the one used for every win here: change one thing,
measure, keep it only if the number goes down.
Failed attempt 3: quantizing colors in the wrong number system
The GBA backend's shaded sprites and triangles go through
gba_palette_index(), a linear scan (up to 256 entries, with a nearest-color
distance calculation once full) that maps a computed RGB555 value onto
BG_PALETTE, since Mode 4 is 8bpp paletted. A one-entry cache handles two
consecutive calls requesting the same value. But continuous per-frame
lighting (examples/lighting, added since this article's original
techniques, orbits two colored point lights around a static sphere and cube)
makes each shaded triangle request a slightly different value almost every
frame. That defeats the cache and saturates the palette within seconds.
The obvious fix was to round each lit color channel to a coarser step, 16
buckets instead of RGB555's 32, before the palette lookup. A gradually changing
light then collapses onto fewer, more repeated values: more cache hits and a
palette that stays truer to intent for longer. The first implementation worked
in float space, where the lit color already was a float:
/* looked free, measured otherwise */
static inline float gba_quantize_channel(float v)
{
    const float steps = 16.0f;
    return (float)(int)(v * steps + 0.5f) * (1.0f / steps);
}
Measured with cycle_probe.py on the same orbiting-lights demo, 150 frames,
steady-state average over frames 101-150: 646528 cycles/frame with no
quantization versus 658869 with it, a ~1.9% regression.
This is still the FPU-less ARM7TDMI. v * steps + 0.5f, the cast and
* (1.0f / steps) are three more soft-float calls on each of the three
channels, for every shaded triangle every frame, which cost more than the
palette-scan time saved. An optimization aimed at this hardware's constraint
had ignored that constraint.
The fix rounds in integer space, using a value the code already computes.
f_to_5bit(), the existing float→RGB555-channel helper, produces a clamped
0-31 integer, and masking off its low bit gives the same 16 buckets for one
AND:
static inline u16 f_to_5bit_quantized(float v)
{
    return (u16)(f_to_5bit(v) & ~1u);
}
Same demo, same measurement: 642455 cycles/frame, a modest ~0.63%
improvement over the no-quantization baseline. The idea was sound; it had to
be expressed in a number system this CPU handles cheaply.
Where this leaves things
examples/simple_cube now sits at 288074 cycles/frame. 16777216 / 288074,
the same ratio cycle_probe.py reports for every measurement here, gives
~58.24fps, against a 60fps budget of 280896 cycles (~59.73fps). That is
about 2.5% over budget, down from roughly 7-8% before this round of work.
spinning_shapes, three shaded objects rotating on all three axes, a heavier
scene by design, sits at 741378 cycles/frame, ~22.63fps. These are
ceilings for these demo scenes on cycle-accurate emulation, not estimates; more
triangles or lights move the frame cost accordingly.
Closing the rest of the gap on simple_cube means riskier changes: caching
ECS query results across frames (beyond the existence check from Technique 4),
or pre-converting mesh vertex data to fixed-point ahead of time instead of
per-vertex at raster time. The latter is complicated because the same mesh
struct is also filled through the engine's public float-only custom-mesh API,
so caching would mean changing that API or building a cache-on-first-use
scheme. Both are bigger than "swap a divide for a multiply", and I am stopping
here rather than chasing harder-to-verify returns from more soft-float removal.
What's next
The GBA backend was the first test of whether framer-engine's approach (an ECS
with 3D, software-rendered, no FPU) holds up on constrained hardware. The next
targets step up in capability: 32-bit-era consoles like the PlayStation 1, and
handhelds with 3D acceleration (PSP, Nintendo DS, 3DS). The goal is an engine
that is pleasant for small demos and indie games on real retro hardware, GBA
included.
At least one of them, probably the PSP with its conventional FPU-plus-GPU
setup, is there for another reason. Every technique here exists because the GBA
has no FPU and no hardware rasterizer. On a platform with both, those tricks do
not apply, and the question becomes how far the engine and hardware go
together. That work is closer to traditional real-time 3D budgeting (draw
calls, vertex throughput, fill rate) than to soft-float avoidance, and needs
the same measurement discipline aimed at a different bottleneck. Whether any of
these tricks carry over is for later articles.