Wireframe Ran at 20 FPS, Solid at 60: Counting ARM9 Cycles to Find Out Why
Introduction
Earlier articles on this blog about the Game Boy Advance and the Nintendo DS, among them the cycle-level optimization one and the one on faking point lights on the DS GPU, shared a premise: these machines have a CPU with no floating-point unit, and a graphics pipeline that makes you pay for every vertex somewhere. The GBA pays in rasterizer cycles. The DS has a real hardware 3D engine, so it pays somewhere else, and that somewhere turned out to be the part of the frame nobody was looking at.
Note
framer-engine is a personal side project. The source code will be made publicly available once the engine reaches a sufficient level of maturity.
The framer-engine spinning_shapes example puts a cube, a sphere and a cone on screen, each rotating, and a button toggles between drawing them solid and drawing them as wireframes. On the DS it ran at 60 FPS in solid and about 20 in wireframe. Wireframe should be the cheaper of the two: fewer pixels filled, no lighting. That a debug visualization would be three times slower than the real thing was the bug report, and there was a second, less obvious question behind it: how do you even measure a frame on a platform you can only run in an emulator?
How wireframe gets drawn on a GPU that has no lines
The DS 3D engine draws triangles and quads, and nothing else: framer-engine's source notes that libnds' glBegin() takes only triangles and quads (and their strips), with no line primitive. The hardware does have a wireframe polygon mode, selected by a polygon alpha of zero, but it outlines a polygon's own edges. The engine's meshes keep a separate list of the edges they actually want drawn, and for a sphere that list leaves out the diagonals that split each patch into two triangles; asking the hardware for wireframe would draw them. (That is the reasoning, not an experiment: the mode was never tried.) So wireframe here means what it does on most hardware without lines: a thin quad along every edge, drawn flat and unlit.
Building that quad takes some care. It has to be widened perpendicular to the edge, in a direction that makes sense for a convex mesh centered on its own origin, so the code takes the direction from the mesh's origin to the middle of the edge and removes the part of it along the edge:
/* per edge, every frame */
float edge_len = sqrtf(edge[0]*edge[0] + edge[1]*edge[1] + edge[2]*edge[2]);
float mid_len  = sqrtf(mid[0]*mid[0] + mid[1]*mid[1] + mid[2]*mid[2]);
dir[k]    = edge[k] / edge_len;          /* k = 0..2 */
radial[k] = mid[k]  / mid_len;
dot       = radial[0]*dir[0] + radial[1]*dir[1] + radial[2]*dir[2];
width[k]  = radial[k] - dot * dir[k];    /* perpendicular to the edge */
width_len = sqrtf(width[0]*width[0] + width[1]*width[1] + width[2]*width[2]);
width[k]  = width[k] / width_len * half_width;
/* then four vertices: a -/+ width, b +/- width, as 4.12 fixed point */
Correct, and unremarkable on a PC. On the DS's ARM9 it is three square roots, nine divides, roughly fifty multiplies and adds and twelve float-to-fixed conversions, per edge, every frame, and every one of those is a call into a software floating-point routine.
Why not just look at the frame rate
The obvious next step, running the ROM in an emulator and reading the frame counter, is the one that tells you least. melonDS' own speed varied a lot from run to run in earlier debugging sessions on this project, so anything derived from wall-clock time or its frame counter says more about the host machine than about the console. What does hold still is the emulated hardware's timers: the same ROM executes the same instructions and the DS timers count them the same way every run.
libnds exposes two of them chained into a 32-bit counter through cpuStartTiming() and cpuEndTiming(), which return ticks of the hardware timer clock (about 33.5 MHz, the bus clock; the ARM9 itself runs at twice that). A throwaway build wraps the 3D render system and stores the result in a global per render mode:
volatile uint32_t g_diag_ticks[2];   /* [0] solid, [1] wireframe */
volatile uint32_t g_diag_count[2];

static void nds_hw3d_render_system(framer_iter_t *it)
{
    int w = framer_render_mode_get_override() ==
            FRAMER_RENDER_MODE_FORCE_WIREFRAME;

    cpuStartTiming(0);
    nds_hw3d_render_system_impl(it);   /* the real system, unchanged */
    g_diag_ticks[w] = cpuEndTiming();
    g_diag_count[w]++;
}
A copy of the example toggles the render mode itself every 120 frames, so one emulator launch produces both numbers, and the globals are read over melonDS' GDB stub, with their addresses taken from nm on the ARM9 ELF:
ticks = struct.unpack('<2I', bytes(rsp.read_mem(sock, tick_addr, 8)))
count = struct.unpack('<2I', bytes(rsp.read_mem(sock, count_addr, 8)))
The first run settled the question. Run twice, the figures agreed to within a few ticks, which is the property that makes them usable:
| Mode | Ticks per frame | Time |
|---|---|---|
| Solid | 317,950 | 9.5 ms |
| Wireframe | 1,414,850 | 42 ms |
A 60 FPS frame is 16.7 ms. Solid fits with room to spare. Wireframe takes 42 ms in the 3D pass alone, which is more than two vertical blanks, so the frame lands on the third and the screen updates every 50 ms: 20 FPS, to the number. The frame rate wasn't a mystery, it was a quantization of a cost.
Where 1.4 million ticks go
The meshes are not small. The sphere has 20 sectors and 10 stacks, which is 430 edges and 360 triangles; the cone adds 40 edges and 40 triangles and the cube 12 and 12. A wireframe frame therefore builds 482 quads, and a solid frame submits 412 triangles. Dividing:
- wireframe: 1,414,850 / 482, about 2,900 ticks per edge, roughly 5,900 ARM9 cycles for the arithmetic above;
- solid: 317,950 / 412, about 770 ticks per triangle, which is a normal and three vertices converted to fixed point and handed to the GPU, with no square root and no divide anywhere in it.
So the GPU was not what set the cost in either mode. The CPU was, and in wireframe it spent 42 ms of every frame, two and a half frame budgets, on arithmetic whose answer is the same on every frame.
The data never changes
That last sentence is the whole fix. The cube is the same cube every frame: only the model matrix it is drawn under changes, and the hardware applies that matrix itself, on the GPU, from a matrix stack. Every square root and every divide in that loop is computing the same four vertices it computed 1/60th of a second earlier.
The DS has a mechanism for exactly this: a display list, a block of pre-packed geometry-engine commands that glCallList() sends to the GPU FIFO by DMA. Its layout is the hardware's own FIFO layout, documented in GBATEK: a first word with the number of words that follow, then groups made of one word holding up to four command ids, one per byte, followed by the parameter words of those commands in order. A quad with four vertices comes out as:
word 0   count
word 1   BEGIN_VTXS | VTX_16 | VTX_16 | VTX_16     (0x23232340)
word 2   1                                          (GL_QUADS)
word 3   x0 | y0 << 16                              vertex 0
word 4   z0
word 5   x1 | y1 << 16                              vertex 1
word 6   z1
word 7   x2 | y2 << 16                              vertex 2
word 8   z2
word 9   VTX_16 | NOP | NOP | NOP                   (0x00000023)
word 10  x3 | y3 << 16                              vertex 3
word 11  z3
Writing the packer is the small part: about eighty lines of plain C with the command ids defined next to it (BEGIN_VTXS is 0x40, NORMAL 0x21 and VTX_16 0x23), no libnds dependency, and so unit-tested on the desktop like any other pure logic in the engine, with the layout above as one of the tests. libnds documents one trap that the packer simply avoids: the END_VTXS command does nothing and is reported to cause trouble in a DMA'd list, so lists never contain it.
void gx_dl_cmd(struct gx_dl *dl, uint8_t id, const uint32_t *params, int n)
{
    if (dl->slot == 4) {                 /* open a new command word */
        dl->cmd_at = dl->len++;
        dl->words[dl->cmd_at] = 0;
        dl->slot = 0;
    }
    dl->words[dl->cmd_at] |= (uint32_t)id << (8 * dl->slot);
    dl->slot++;
    for (int i = 0; i < n; i++)
        dl->words[dl->len++] = params[i];
}
The renderer bakes a mesh the first time it is drawn in a given mode: the edge quads for wireframe, the triangles with their flat normals for solid. After that a draw is a colour, a glCallList() and nothing else. Only what is identical on every draw goes into a list; the colour, the material, the polygon format and the model matrix stay with the caller, so the same list serves every object that shares a mesh. Two kinds of object keep the old triangle-by-triangle path because they vary something a list would have to hold: objects with a colour per face, since the material changes between faces, and textured ones, since their texture coordinates are scaled by the texture's size. The old immediate wireframe code also stays, as the fallback for a mesh that cannot be baked: more than eight different meshes in a program, or no memory left for the list.
Results
Same scene, same instrumented build, measured the same way:
| Mode | Before | After | Change |
|---|---|---|---|
| Solid | 317,950 | 18,500 | 17 times cheaper |
| Wireframe | 1,414,850 | 24,450 | 58 times cheaper |
The wireframe pass goes from 42 ms to 0.73 ms and solid from 9.5 ms to 0.55 ms. The two modes now cost about the same, which is what the original bug report had assumed all along.
Faster is only worth anything if it is the same picture. The figure below is the top screen before and after, captured from the emulator window in the same runs as the numbers; the shapes are at different points of their rotation because the demo keeps spinning, but the shading and the lines are the same.
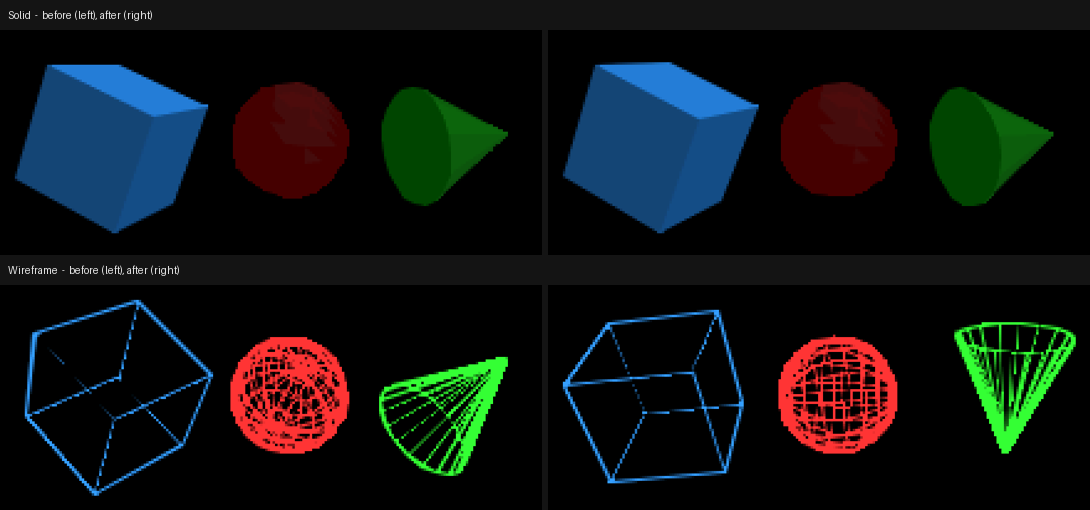
Solid and wireframe, before (left) and after (right).
Three caveats belong next to those numbers:
- The GPU still has to consume the list. glCallList() flushes the list from the data cache, starts the DMA and waits for it to finish, and the DMA only completes once the geometry FIFO has accepted the data. melonDS models the geometry engine's timing only roughly, so on a real console that wait will be longer than 0.7 ms. It is waiting on the GPU, not computing, and nothing was measured on real hardware.
- The first draw pays the old price once. Baking runs the original math one time per mesh and mode, so the first frame in wireframe still does what every frame used to. It is a one-off hitch rather than a rate, and an unmeasured one.
- Lists cost memory. About 15 KB for the sphere's wireframe and 12 KB for its solid list, allocated from the heap and held for the life of the program.
A footnote on quitting a debugger session
One practical thing came out of the measuring that is worth passing on to anyone scripting melonDS' GDB stub. A script that interrupts the target, reads what it needs and closes the socket leaves the emulated CPU halted at the interruption, and the stub then keeps a dead connection in CLOSE-WAIT: the emulator can no longer be quit from its window, a new connection times out, and SIGTERM has no effect (with the Flatpak build of melonDS at least; my guess is that, as the first process of its own sandbox, it does not get the default signal handling when the signal comes from outside, but I did not verify that). The fix has two halves: always send continue before disconnecting, so the target is running again when the connection goes, and stop a stuck instance with flatpak kill rather than reaching for kill -9.
What is still on the slow path
Objects with per-face colours and textured objects still submit triangle by triangle, so a scene dominated by them gets none of this. Both can be baked too: a per-texture-size list for the textured case, and one list per colour run for the face-coloured one. They are the next candidates, and the same method applies: measure the render system's ticks first, in the mode that looks slowest, and let the number say where the frame went.